
Welcome to the inaugural Maslow Wealth Barside Chat! It has been an eventful start to 2024 (including our rebrand), with many questions surrounding what to expect for the remaining three quarters. When it comes to investing, sometimes it’s best to look to the past to inform the future. Nearly a century of US stock and bond market data has allowed us to understand what returns and risks we can expect. With that powerful information, we can customize portfolios that achieve investor goals—rather than chase the most recent investment fad that defies expectations.
In the latest installment of Maslow Wealth Barside Chat, Chief Investment Officer Matthew Jachimiak sits down with Senior Advisor Kevin Tiernan to discuss investment considerations for 2024, from the US presidential election to global stock market valuations. Our goal is to provide unique and valuable insights, so please feel free to reach out to your advisor if there is a topic you would like to hear more about.
3 Common Investing Mistakes
Many people start out managing their own investments. But as their earnings and assets grow, their financial needs and challenges become more complex—and continuing to go it alone could prove costly in terms of investing miscues. Consider three common mistakes that can reduce returns and increase anxiety:
1. Trying to Time the Market
Investors may be tempted to cash out of the stock market to avoid a predicted downturn. But accurately forecasting the market’s direction to time when to buy and sell is a guessing game. Missing only a brief period of strong market performance can drastically affect your lifetime wealth.
For example, the chart below shows a hypothetical investment in the Russell 3000 Index, a broad US stock market benchmark. Over the entire 25-year period ending December 31, 2023, a $1,000 investment in 1999 turned into $6,449. But what if you pulled your cash out at the wrong time? Missing the best week, month, three months, or six months would have significantly reduced the growth of your investment.
The Cost of Missing the Best Consecutive Days
Russell 3000 Index total return, 1999-2023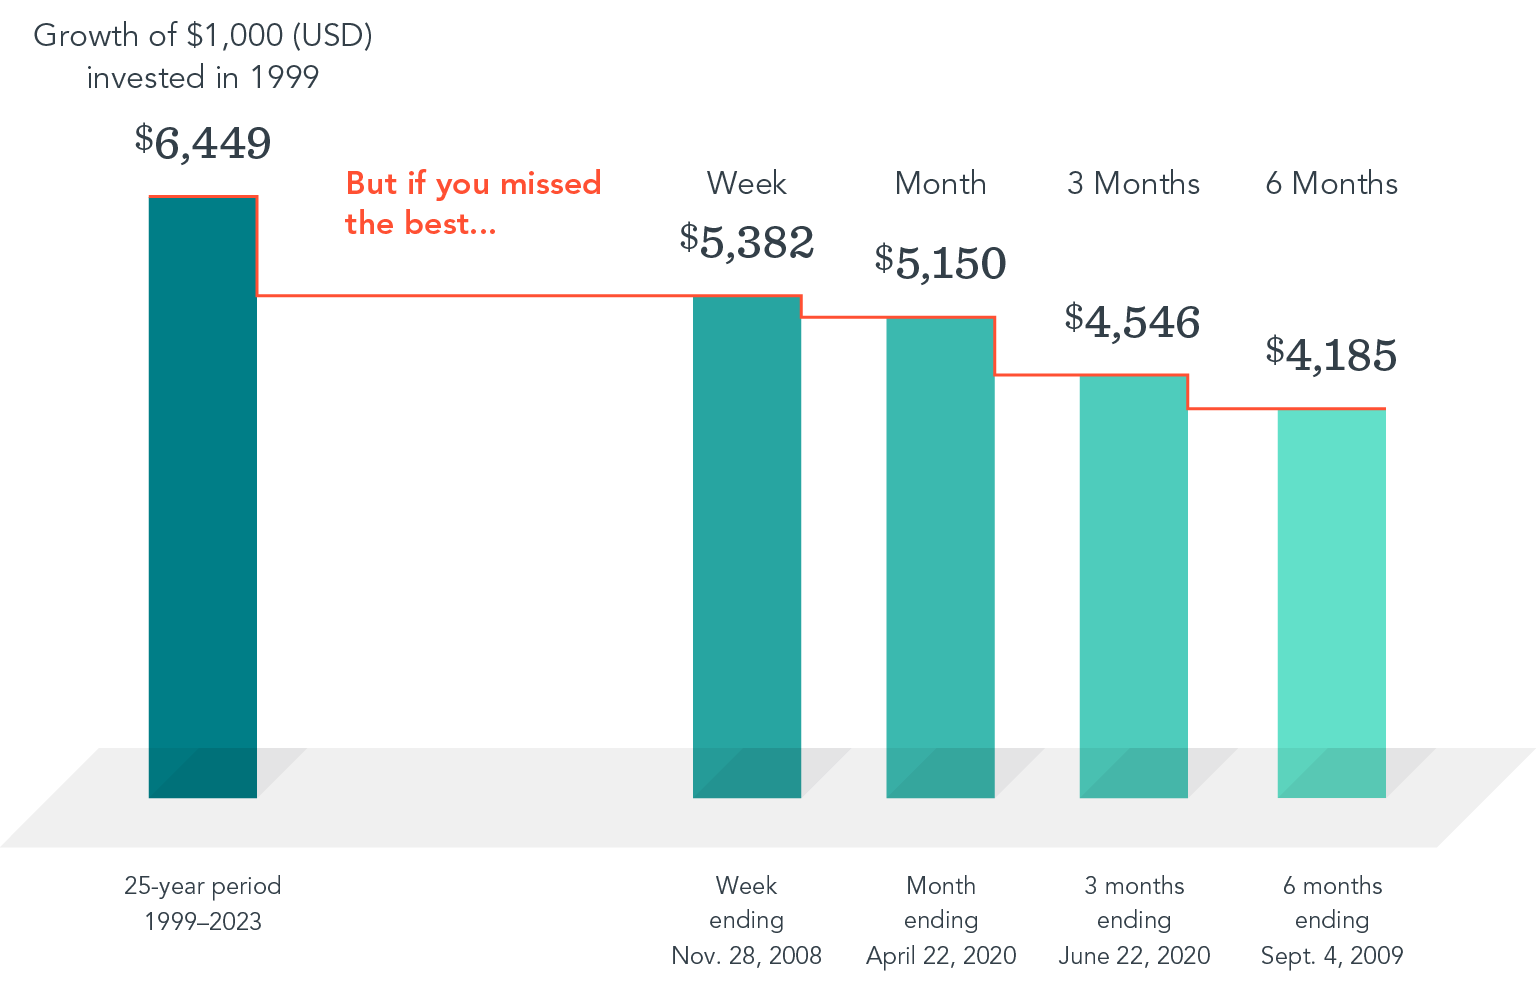
Past performance is no guarantee of future results. Indices are not available for direct investment. Their performance does not reflect the expenses associated with the management of an actual portfolio.
Rather than trying to predict when stocks will rise and fall, investors can hold a globally diversified portfolio—and by staying invested, be better positioned to capture returns whenever and wherever they occur.
2. Focusing on the Headlines
Investors may become enamored with popular stocks based on recent performance or media attention—and overconcentrate their portfolio holdings in these companies. One example is the rise of the large US technology companies known as the Magnificent 7 (Alphabet, Amazon, Apple, Meta Platforms, Microsoft, NVIDIA, and Tesla). But the chart below shows that many fast-growing stocks have stopped outperforming after becoming one of the 10 largest stocks in the US. On average, companies that outperformed the market on the way up failed to outperform in the years after making the Top 10 list.
Stocks on the Way Up, and After
Average annualized outperformance of companies before and after the year they became one of the 10 largest in the US, 1927-2023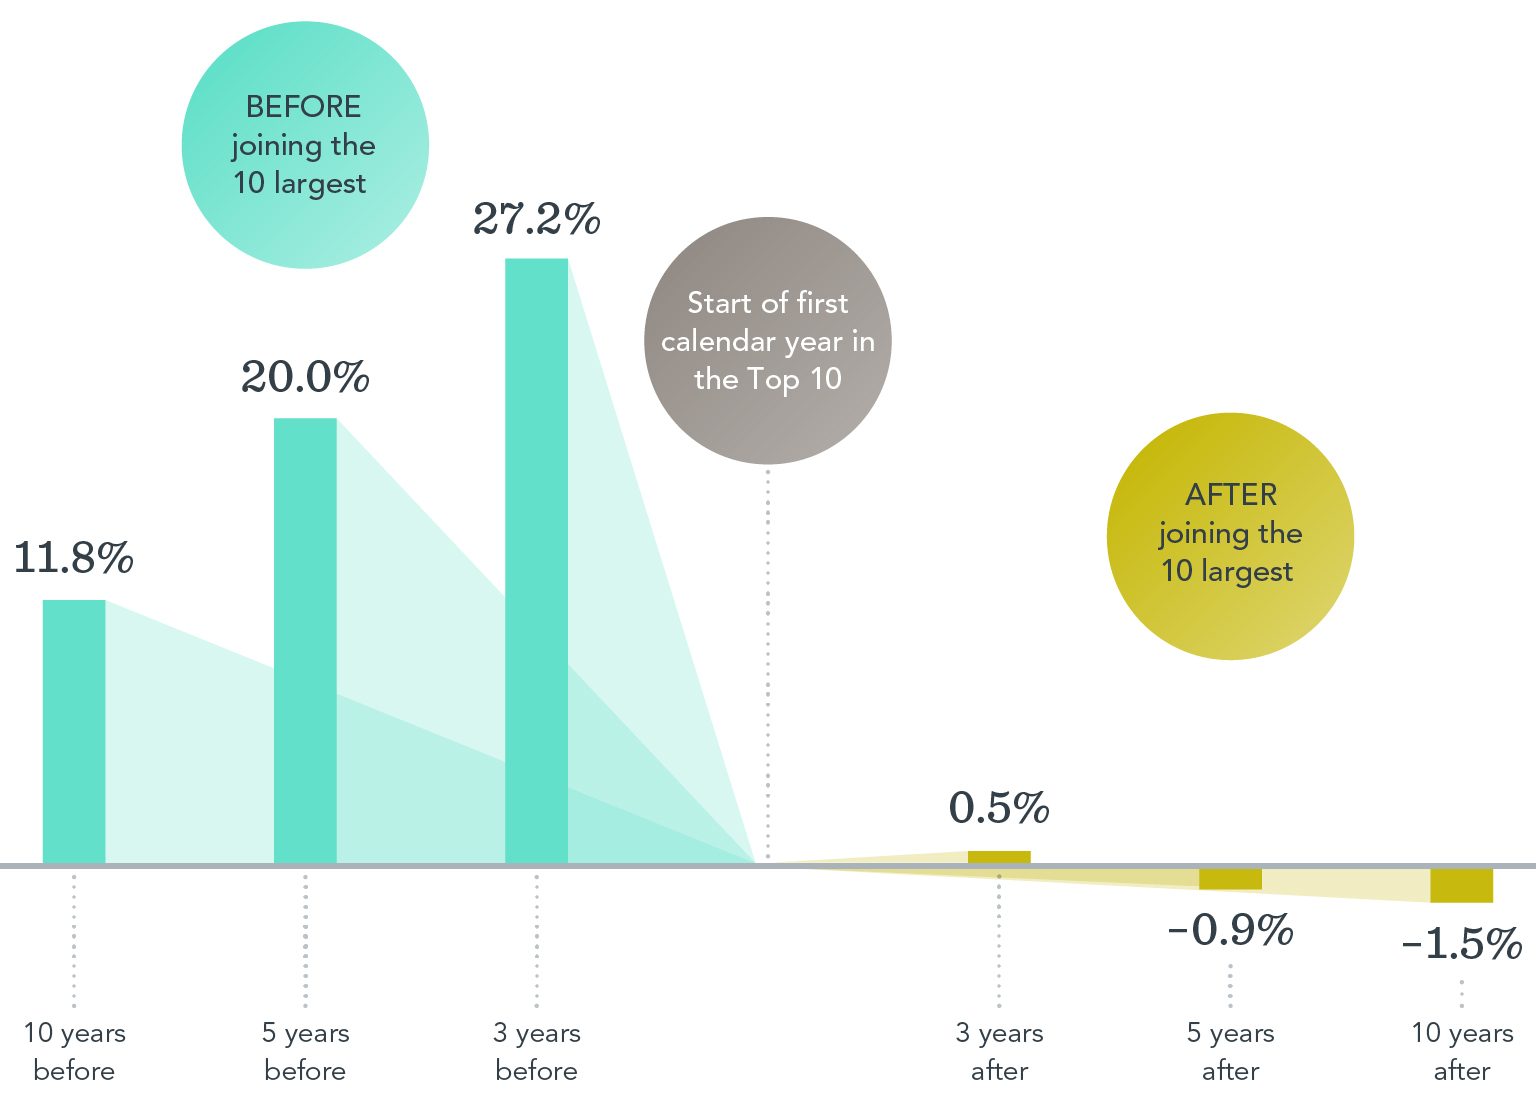
Past performance is no guarantee of future results. This information is intended for educational purposes and should not be considered a recommendation to buy or sell a particular security.
The lesson? Rather than loading up on a handful of stocks that have dominated the market, you can own many stocks through mutual funds or ETFs. Diversifying across industries and global markets can help reduce overall risk and position investors to potentially capture the returns of future top-performing companies.
3. Chasing Past Performance
You might be inclined to select investments based on past returns, expecting top-ranked funds to continue delivering the best performance. But can they maintain that outperformance? Research shows that most funds ranked in the top 25% based on five-year returns didn’t remain in the top 25% in the next five years. In fact, only about one in five equity funds stayed in the top-performing group, and only about a third of fixed income funds did. The lesson? A fund’s past performance offers limited insight into its future returns.
Percentage of Top-Ranked Funds that Stayed on Top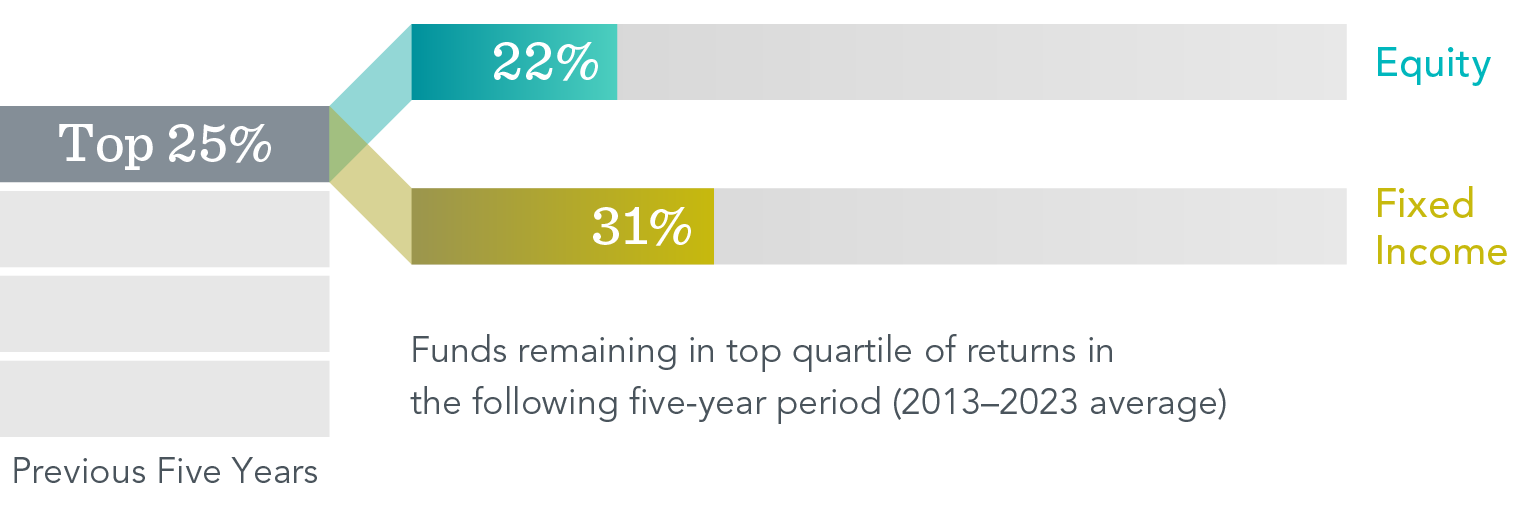
Past performance is no guarantee of future results.
Working with an Advisor
Avoiding these mistakes can improve the odds of reaching your long-term investment goals. But, as a do-it-yourself investor, you’ll have to manage the challenge alone. A qualified financial advisor can offer deeper expertise and insights that lead to better financial habits.
But the potential benefits go beyond just helping you avoid a bad decision. An advisor can design a diversified, research-backed investment strategy based on your long-term goals and comfort level with risk. Equally important, you can look to a seasoned professional for guidance through different markets. By walking with you on the journey, an advisor can encourage the discipline essential to building wealth over time.
DISCLOSURES
Percentage of Top-Ranked Funds that Stayed on Top Data Sample
The sample includes US-domiciled, USD-denominated open-end and exchange-traded funds (ETFs) in the following Morningstar categories. Non-Dimensional fund data provided by Morningstar. Dimensional fund data is provided by the fund accountant. Dimensional funds or subadvised funds whose access is or previously was limited to certain investors are excluded. Index funds, load-waived funds, and funds of funds are excluded from the industry sample.
Percentage of Top-Ranked Funds that Stayed on Top Methodology
This study evaluated fund performance over rolling periods from 2004 through 2023. Each year, funds are sorted within their category based on their previous five-year total return. Those ranked in the top quartile of returns are evaluated over the following five-year period. The chart shows the average percentage of top-ranked equity and fixed income funds that kept their top ranking in the subsequent period.
Percentage of Top-Ranked Funds that Stayed on Top Morningstar Categories (Equity)
Equity fund sample includes the following Morningstar historical categories: Diversified Emerging Markets, Europe Stock, Foreign Large Blend, Foreign Large Growth, Foreign Large Value, Foreign Small/Mid Blend, Foreign Small/Mid Growth, Foreign Small/Mid Value, Global Real Estate, Japan Stock, Large Blend, Large Growth, Large Value, Mid-Cap Blend, Mid-Cap Growth, Mid-Cap Value, Miscellaneous Region, Pacific/Asia ex-Japan Stock, Real Estate, Small Blend, Small Growth, Small Value, Global Large-Stock Blend, Global Large-Stock Growth, Global Large-Stock Value, and Global Small/Mid Stock.
Percentage of Top-Ranked Funds that Stayed on Top Morningstar Categories (Fixed Income)
Fixed income fund sample includes the following Morningstar historical categories: Corporate Bond, High-Yield Bond, Inflation-Protected Bond, Intermediate Core Bond, Intermediate Core-Plus Bond, Intermediate Government, Long Government, Muni California Intermediate, Muni California Long, Muni Massachusetts, Muni Minnesota, Muni National Intermediate, Muni National Long, Muni National Short, Muni New Jersey, Muni New York Intermediate, Muni New York Long, Muni Ohio, Muni Pennsylvania, Muni Single State Intermediate, Muni Single State Long, Muni Single State Short, Muni Target Maturity, Short Government, Short-Term Bond, Ultrashort Bond, Global Bond, and Global Bond-USD Hedged.
Percentage of Top-Ranked Funds that Stayed on Top Index Data Sources
Index data provided by Bloomberg, MSCI, Russell, FTSE Fixed Income LLC, and S&P Dow Jones Indices LLC. Bloomberg data provided by Bloomberg. MSCI data © MSCI 2024, all rights reserved. Frank Russell Company is the source and owner of the trademarks, service marks, and copyrights related to the Russell Indexes. FTSE fixed income indices © 2024 FTSE Fixed Income LLC. All rights reserved. S&P data © 2024 S&P Dow Jones Indices LLC, a division of S&P Global. All rights reserved.
Indices are not available for direct investment. Their performance does not reflect the expenses associated with management of an actual portfolio. US-domiciled mutual funds and US-domiciled ETFs are not generally available for distribution outside the US.
This information is intended for educational purposes and should not be considered a recommendation to buy or sell a particular security. Named securities may be held in accounts managed by Dimensional.
Fama/French Total US Market Research Index: The value-weighted US market index is constructed every month using all issues listed on the NYSE, AMEX, or Nasdaq with available outstanding shares and valid prices for that month and the month before. Exclusion: American depositary receipts. Source: CRSP for value-weighted US market return. Rebalancing: monthly. Dividends: reinvested in the paying company until the portfolio is rebalanced.
The Fama/French indices represent academic concepts that may be used in portfolio construction and are not available for direct investment or for use as a benchmark. Index returns are not representative of actual portfolios and do not reflect costs and fees associated with an actual investment.
Results shown during periods prior to each Index’s index inception date do not represent actual returns of the respective index. Other periods selected may have different results, including losses. Backtested index performance is hypothetical and is provided for informational purposes only to indicate historical performance had the index been calculated over the relevant time periods. Backtested performance results assume the reinvestment of dividends and capital gains.
Eugene Fama and Ken French are members of the Board of Directors of the general partner of, and provide consulting services to, Dimensional Fund Advisors LP.
Risks include loss of principal and fluctuating value. Investment value will fluctuate, and shares, when redeemed, may be worth more or less than their original cost. Diversification does not eliminate the risk of market loss.
Dimensional makes no representation as to the suitability of any advisor, and we do not endorse, recommend, or guarantee the services of any advisor.
Individuals should carefully evaluate any advisor whom they may consider hiring. Individuals are responsible for monitoring their advisor’s investment performance.
The information in this material is intended for the recipient’s background information and use only. It is provided in good faith and without any warranty or representation as to accuracy or completeness. Information and opinions presented in this material have been obtained or derived from sources believed by Dimensional to be reliable, and Dimensional has reasonable grounds to believe that all factual information herein is true as at the date of this material. It does not constitute investment advice, a recommendation, or an offer of any services or products for sale and is not intended to provide a sufficient basis on which to make an investment decision. Before acting on any information in this document, you should consider whether it is appropriate for your particular circumstances and, if appropriate, seek professional advice. It is the responsibility of any persons wishing to make a purchase to inform themselves of and observe all applicable laws and regulations. Unauthorized reproduction or transmission of this material is strictly prohibited. Dimensional accepts no responsibility for loss arising from the use of the information contained herein.
This material is not directed at any person in any jurisdiction where the availability of this material is prohibited or would subject Dimensional or its products or services to any registration, licensing, or other such legal requirements within the jurisdiction.
“Dimensional” refers to the Dimensional separate but affiliated entities generally, rather than to one particular entity. These entities are Dimensional Fund Advisors LP, Dimensional Fund Advisors Ltd., Dimensional Ireland Limited, DFA Australia Limited, Dimensional Fund Advisors Canada ULC, Dimensional Fund Advisors Pte. Ltd., Dimensional Japan Ltd., and Dimensional Hong Kong Limited. Dimensional Hong Kong Limited is licensed by the Securities and Futures Commission to conduct Type 1 (dealing in securities) regulated activities only and does not provide asset management services.
RISKS
Investments involve risks. The investment return and principal value of an investment may fluctuate so that an investor’s shares, when redeemed, may be worth more or less than their original value. Past performance is not a guarantee of future results. There is no guarantee strategies will be successful.
UNITED STATES
Dimensional Fund Advisors LP is an investment advisor registered with the Securities and Exchange Commission.
Investment products: • Not FDIC Insured • Not Bank Guaranteed • May Lose Value
Dimensional Fund Advisors does not have any bank affiliates.